- Iterate
- Organizational Structure
- How to Create a Flowchart in Google Suite
How to Create a Flowchart in Google Suite
Table of contents
A simple guide on using Google’s tools to create a flowchart.

What is a flowchart?
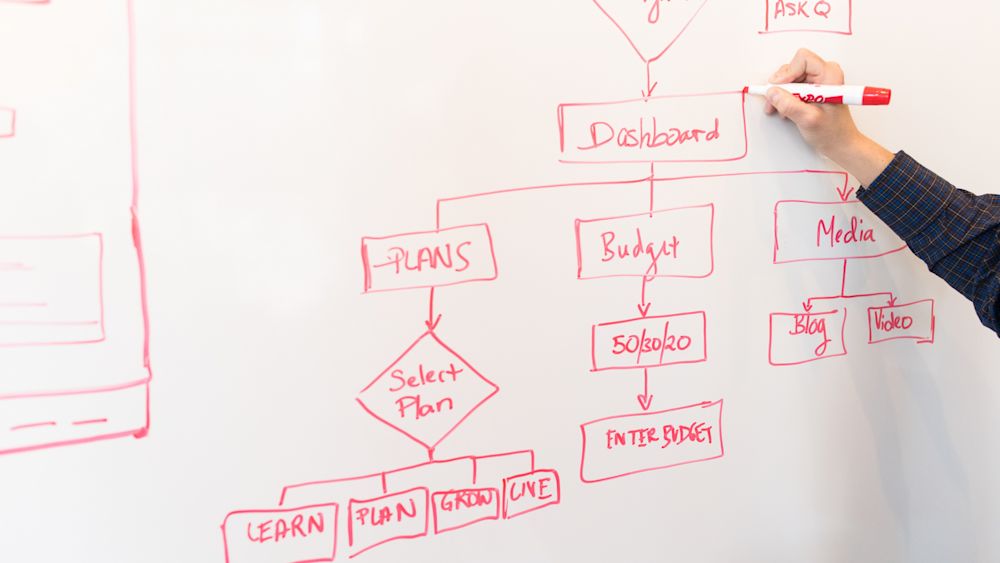
A flowchart is a diagram that is used to convey a complex process, algorithm or system. It is a versatile tool used by many industries and teams to depict the sequential flow of activities required for a project. Flowcharts make use of special shapes and symbols to represent the different actions during the process, allowing each step to be easily distinguished.
People use flowcharts because converting a process into a graphical representation can be extremely useful for getting a team on the same page, standardizing processes and improving efficiency. Like using a work breakdown structure, having an outline to organize the scope of a process allows employees to easily identify the essential steps while giving them a broad, transparent view of the entire operation.
The three types of flowcharts
There are three types of flowcharts and each serves a different purpose, but can be modified to work for different use cases.
Process flowchart
A process flowchart or process flow diagram (PFD) is a visual representation of the sequential steps in a business process, and it is typically used by engineering and chemical practices.
Data flowchart
Data flowcharts are used to visualize data processes, simplify data management and map out the flow of information. It utilizes the different shapes to show data input and output, storage points and its journey.
Business process diagram
A business process diagram is used for process improvement within an organization. It illustrates business activities and the way in which information flows, allowing for better efficiency and comprehension between team members and stakeholders.
How to create a flowchart in Google Workspace
There are many tools you can use to create a flowchart and Google’s many enterprise resources are a great option. Google enables you to create diagrams in either Google Slides or Google Docs by using Google Drawings. Let's dive into how to make a flowchart using either of these methods.
Google Slides:
Creating a flowchart in Google Slides allows you to convey a complicated process into something simple without the need for flowchart templates or diagram software.
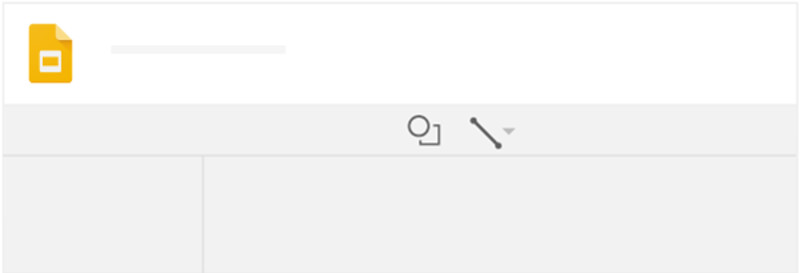
- First, Add shapes to the slide. In the top menu bar, you will see a shape button where you can add and combine a variety of shapes to the page. Make sure to follow the keycode of what the different shapes mean within a flowchart.

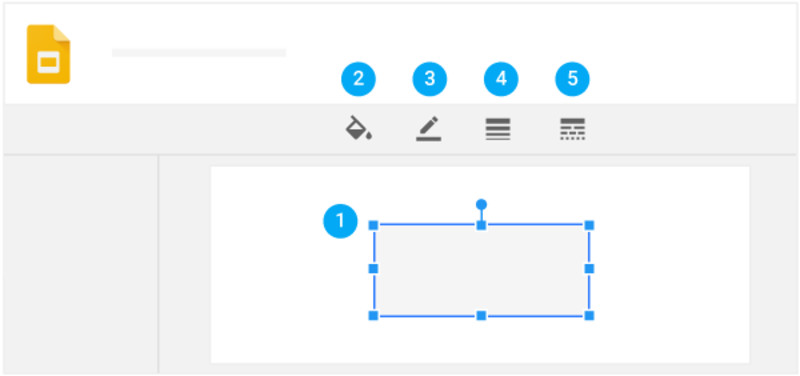
- Next, customize the shapes by dragging the borders to resize and changing the color. Add text by inserting a text box and writing a brief description. Flow charts usually have very few words within the shapes, and using one to three words to describe the action is enough.

- Finally, insert lines and arrows using the shape or line options in the top menu bar. Use these to connect the shapes into a successive order and depict the flow.
Google Docs:
To create a flowchart directly in Google Docs you will need to utilize Google’s native app for diagrams: Google Drawings. This process is very similar to building a flowchart in Slides.
-
First, go to the Google Docs menu bar and select Insert, then Drawing, then New.
-
Next, insert shapes and lines via the icons to add the different action items to the process.
-
Finally, customize and arrange the pieces into a systemized diagram.
Successful businesses are always looking for new ways to streamline their workflows and processes because it is easy for systems to get out of order as a company scales. Creating a flowchart is a great way to document and communicate complicated systems and business procedures across a team. For more ways to build a better organization and increase productivity, sign up for The Org.
Create your own free org chart today!
Show off your great team with a public org chart. Build a culture of recognition, get more exposure, attract new customers, and highlight existing talent to attract more great talent. Click here to get started for free today.
In this article


The ORG helps
you hire great
candidates
Free to use – try today